July 15th, 2026
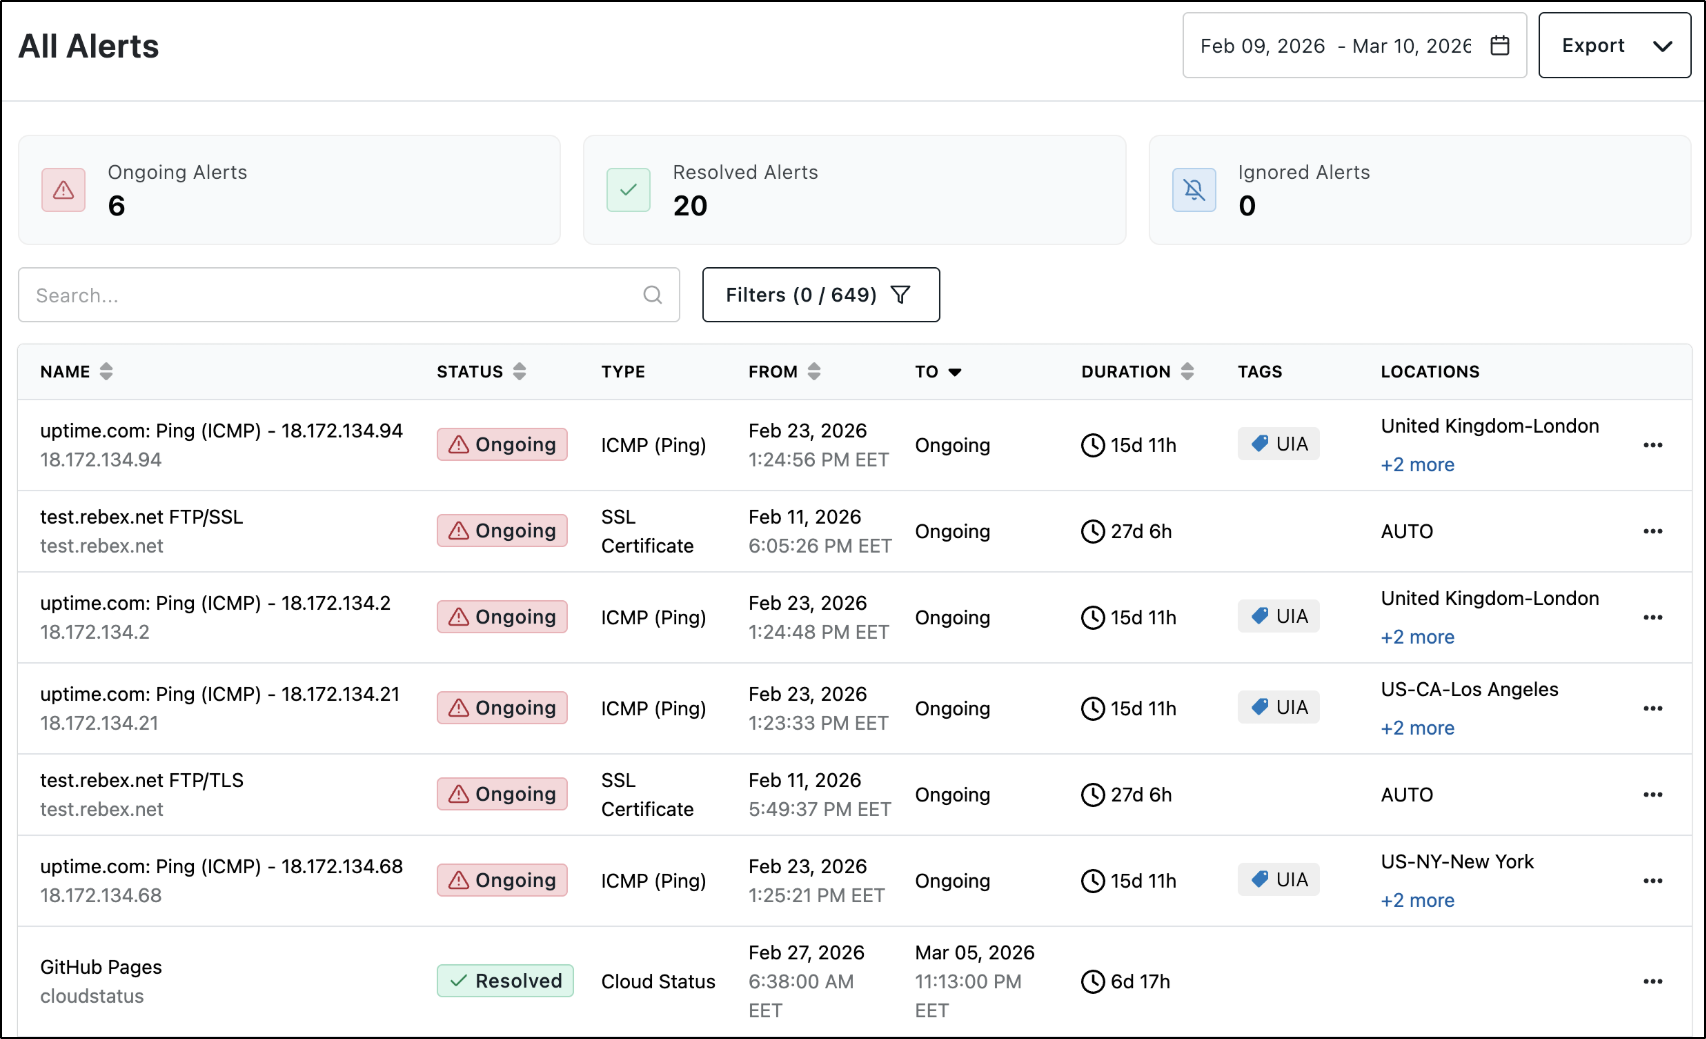
We have updated the default sort order of the Alerts table. Ongoing alerts are now displayed at the top, followed by alerts with an end date and time. This makes currently active downtime more easily visible and places higher visual importance on issues that should be prioritized.
For more information on Alerts, see our documentation here.
July 15th, 2026
As part of our commitment to continuously expanding our coverage of third-party services in Cloud Status checks, we have added a new monitoring option: Citrix Cloud.
For more information on Cloud Status checks, see our documentation here.
July 10th, 2026
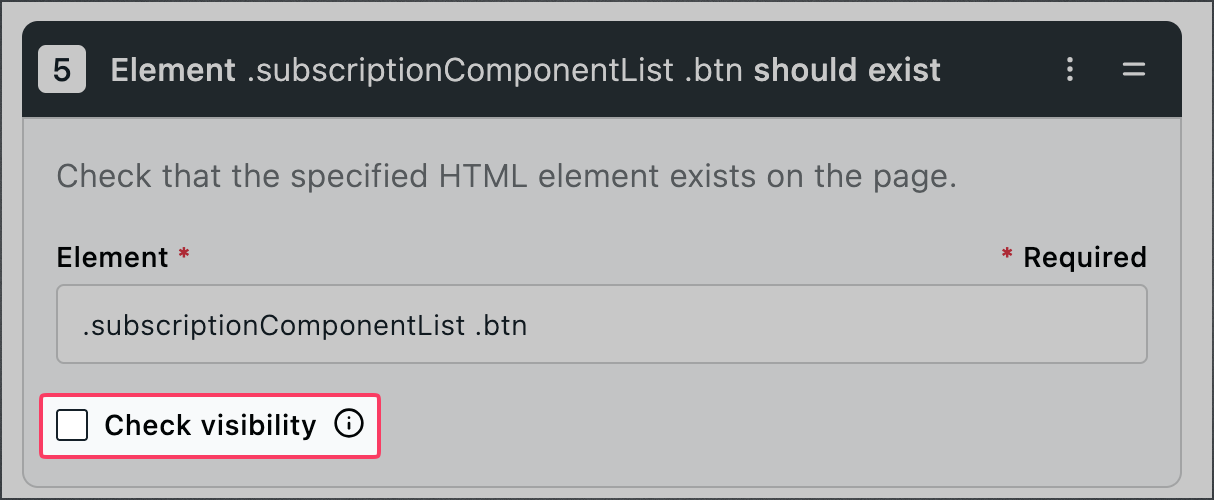
We have added a new Check Visibility option to the Element exists step in Transaction Checks.
Wait for Element To Exist/Not Exist
Wait for Element To Contain Text/Not Contain Text
Element Should/Should Not Exist
Element Should/Should Not Contain Text
Previously, a step would pass as long as the element was found in the page, even if it was not visible to the user. Now with the update, you can now choose to also validate that the element is actually visible.
To use this option, in the Transaction Check, tick the Check Visibility box.
An element is considered visible when all of the following conditions are met:
It has computed styles.
It has a non-empty bounding client rect.
Its visibility is not set to
hiddenorcollapse.
For more information on our Transaction Check, check our documentation.
July 9th, 2026
We have released a new version of our mobile app for both iOS and Android. This release ensures the app is fully compatible with new maintenance window features and also includes general performance improvements and bugfixes.
Download our Mobile App (iOS, Android) today!
For more information, see our support article on the Uptime.com Mobile App.
July 8th, 2026
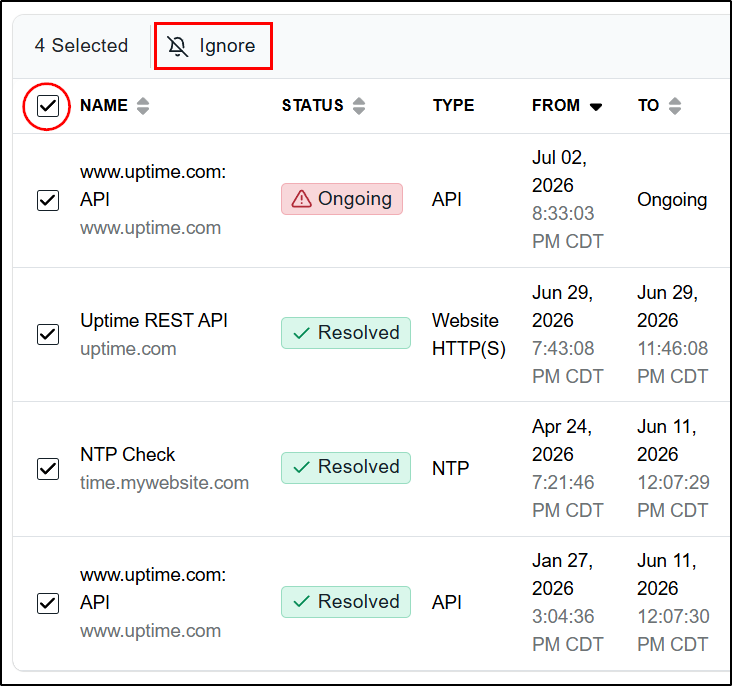
We have extended bulk actions to additional views across our platform:
Alerts – Select multiple alerts and bulk ignore.
Incidents – Select multiple incidents and bulk delete.
SLA Reports – Select multiple reports and bulk delete.
Scheduled Reports – Select multiple reports and bulk delete.
Private Locations – Select multiple private probe servers and bulk delete.
If you have more questions about Bulk Actions, send an email to support@uptime.com.
July 8th, 2026
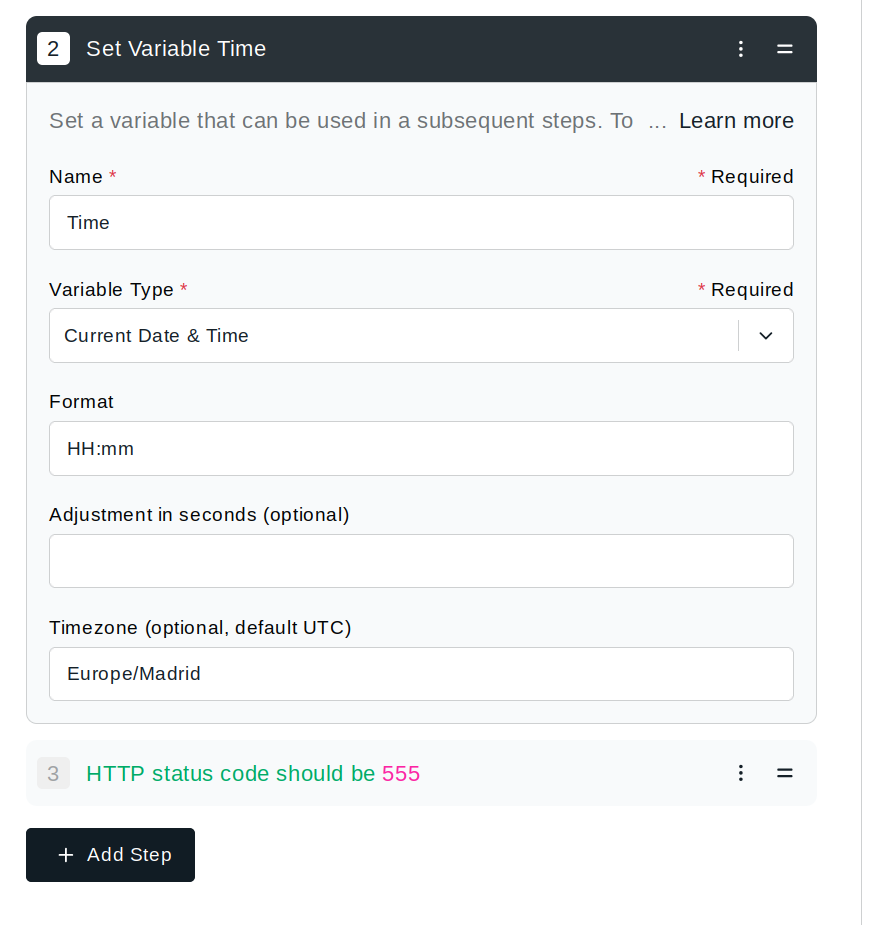
We have recently upgraded our transaction checks with new capabilities as part of the Authentication & Settings, Set Variable, and IF condition commands.
Geolocation: Enables browser location requests to be automatically answered with configured latitude, longitude, and accuracy values for testing location-aware applications.
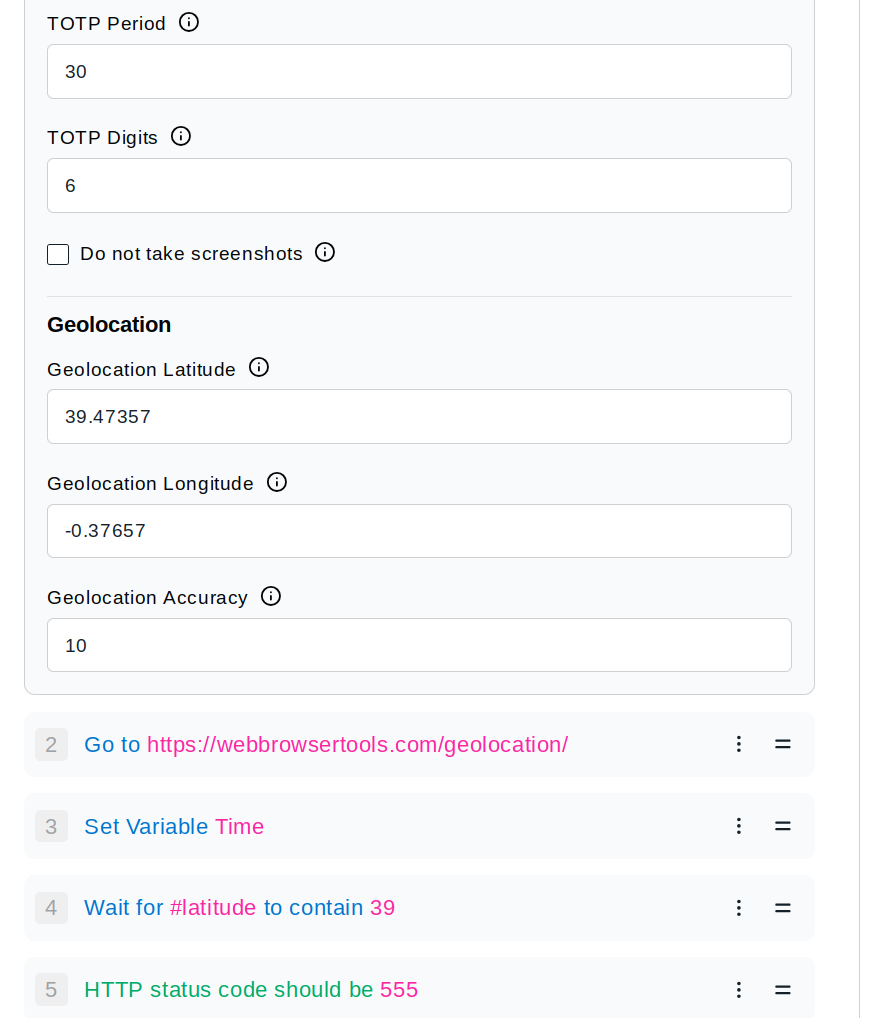
Timezone: Allows date and time values to be generated and processed using a specified timezone.
If-Then: Adds conditional behavior to a check step. For example, add an IF step (indicating all validation conditions pass), THEN perform an additional command or validation. ELSE, perform other commands or validations:
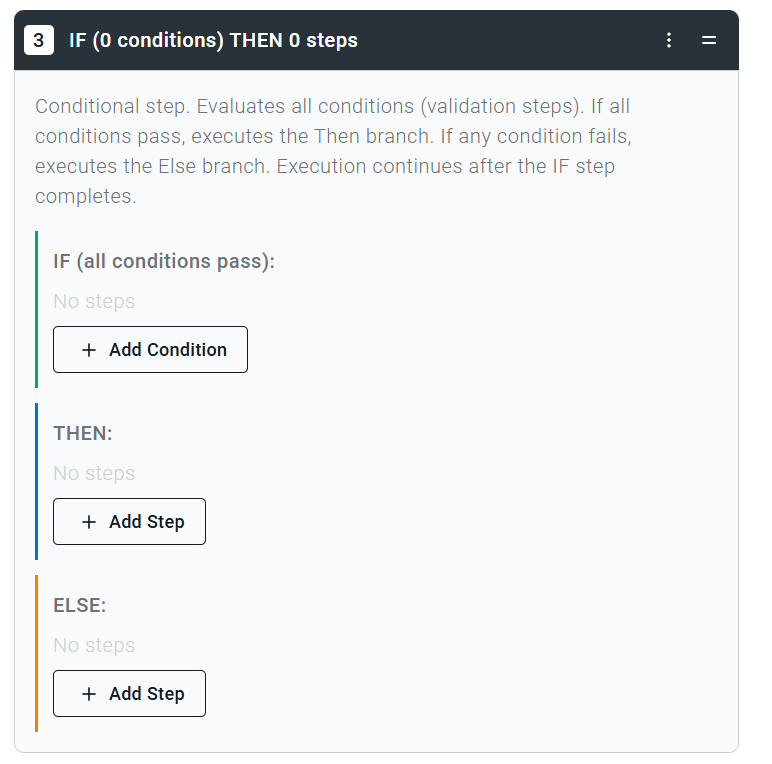
For more information, please read our documentation on Transaction Check Commands and Validators.
July 8th, 2026
We have added the following services to our Cloud Status Check:
For more information on Cloud Status checks, see our documentation here.
July 2nd, 2026
We've added new API endpoints that give you more flexibility in how you access and work with your metrics data. You can now discover what metrics are available for a given check, query raw or aggregated data over custom time ranges, and view available dimensions for a check type.
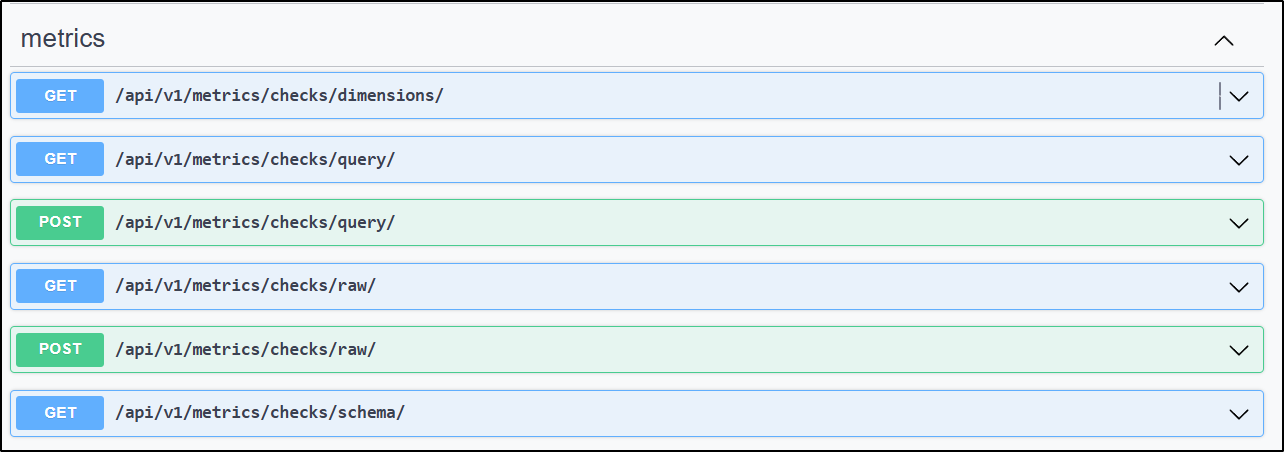
To view the endpoints and their recommended usage and schema, please see the Metrics endpoint section in our API documentation.
July 1st, 2026
When searching for checks, it is now possible to search by tag. The search results will only display checks associated with that tag.
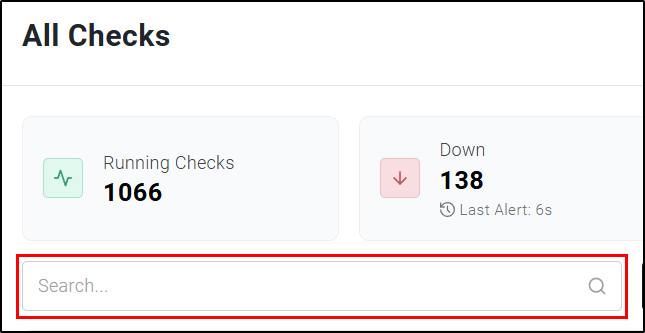
For more information, see our documentation on Tags and Filtering Basics.
July 1st, 2026
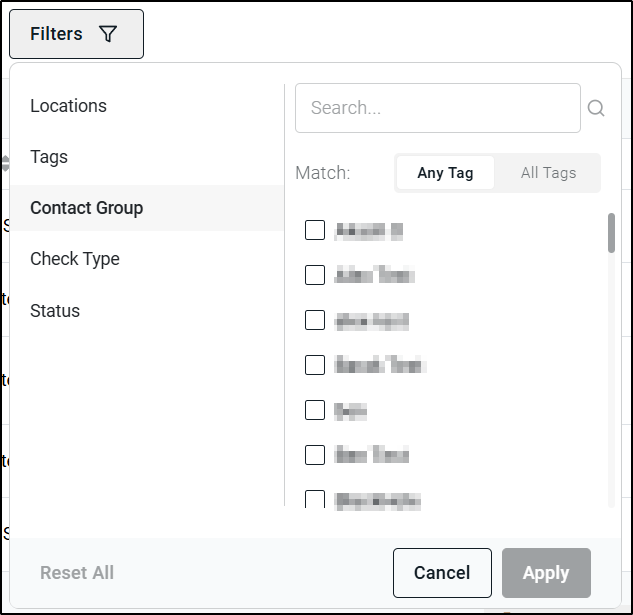
When filtering checks, you now have the option to find checks that are associated with a Contact Group. Only checks that are associated with that contact (by having the contact added under the General tab when creating or editing the check) will be displayed.
For more information, see our documentation on Tags and Filtering Basics.